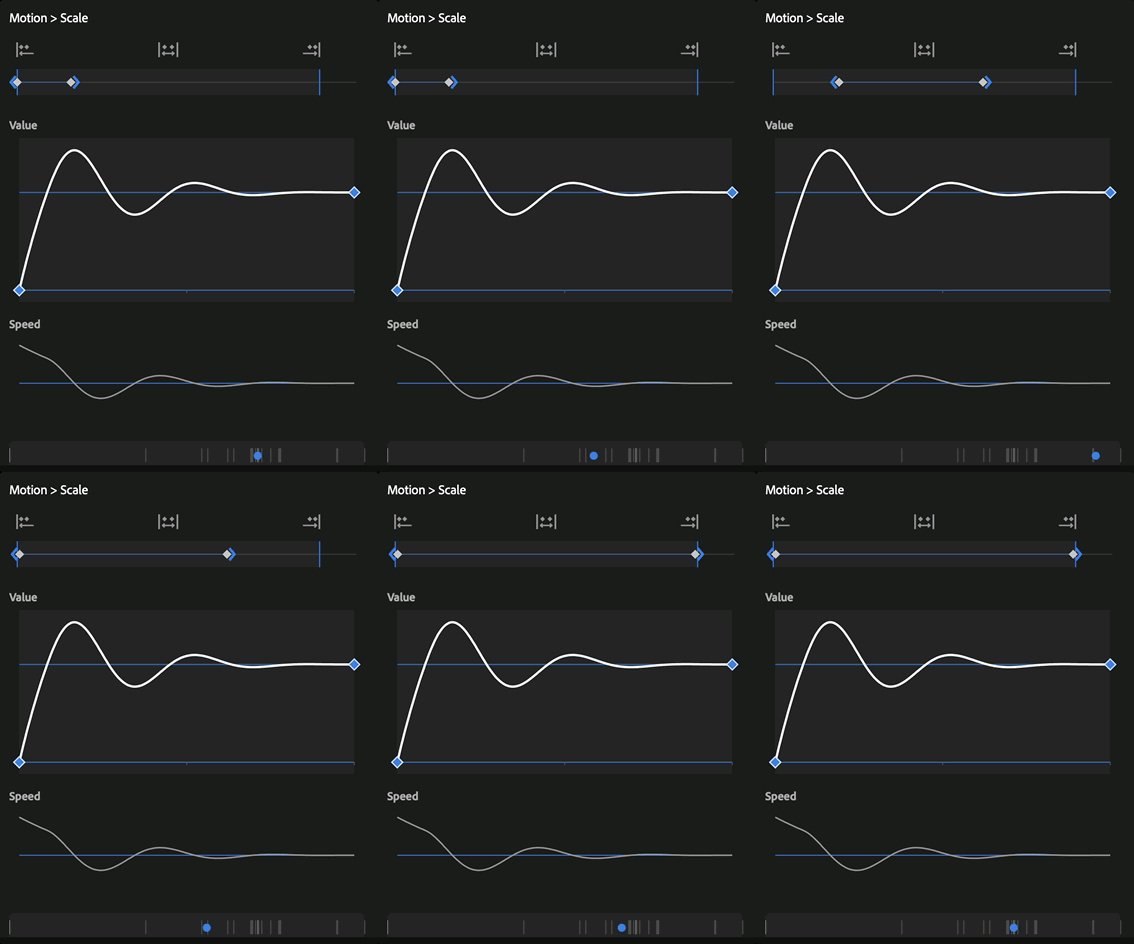
Value and Speed
When you open a property, the animation appears in two graphs: Value and Speed.
1 Value
The Value shows the value over time: the curve that the animation makes, with the eases, the holds as steps, and two reference lines marking the initial and the final value of the stretch.
2 Speed
The Speed shows the speed of that same movement, with the zero line in the middle: when the curve is above the line the value is going up, and when it is below the line it is going down.
3 The preview
A little ball that runs along the curve. See The preview.
The two graphs share the same time ruler, so that the speed peak sits exactly under the stretch of the animation that generated it, and it becomes very easy to identify where the animation is slow and where it is fast.
Still in the Value graph
You can click a keyframe to select it, or use Shift + click to select a range and edit only that stretch.
1 is the keyframe clicked first, 2 the one clicked with Shift. The line between them is white. You can drag a keyframe to change the moment in which it happens.
Alt (Windows) or Option (Mac) + scroll zooms at the point where the cursor is, and the Fit button goes back to the whole view.
The preview
At the bottom there is a preview: a little ball that runs along the curve, and behind it spacing marks that show the timing of the whole animation at once, closer together where the movement is slow and more spaced where it is fast. If you select a stretch of the animation, the preview runs only that stretch.